

- /
Our Strategic Analysis: Three Steps to Clarity
We move beyond general headlines. Our strategic analysis blends macro data with local expertise, summarized below.

ANALYZE THE MACRO MARKET
DEEP DIVE THE MICRO MARKET
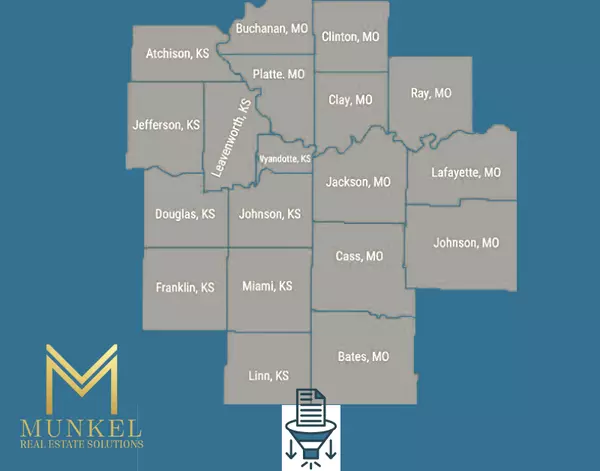
We overlay proprietary local listing data, for the 8 core KC counties to assess local price momentum.

APPLY INSIGHTS TO YOUR HOME
We apply hyper-local data to your property for the most accurate and aggressive price strategy.

National Housing Brief
National home sales edged higher in September, but higher borrowing costs are still making it difficult for many buyers to move. Existing-home sales rose 1.5% from August and remained 2.2% below last September. The median sale price, the middle price among homes sold, rose 1.3% from a year earlier to $417,500.
The later report on signed contracts gives a more cautious signal. National pending home sales fell 7.3% from August. Those agreements help indicate what may close in the months ahead, so the small increase in completed sales does not establish a lasting recovery.
Buyers had more homes to choose from nationally, with inventory up 4.6% from a year ago. About one in five listings had a price reduction in September. That can create room to negotiate, but a better price does not always solve a difficult monthly payment.
Freddie Mac's average 30-year fixed mortgage rate was 7.32% on October 22, down slightly from 7.40% the week before. That offers some relief, but buyers still need to work from the payment available to them today. September's completed sales reflect purchase decisions made earlier.
The pressure also differs from one household to the next. A cash buyer avoids the mortgage cost. A buyer using financing has to make the payment work. An owner with a low-rate mortgage must weigh the cost of the next home against the reason for moving. Each needs a different plan, even when looking at the same market.
The Munkel Thesis:
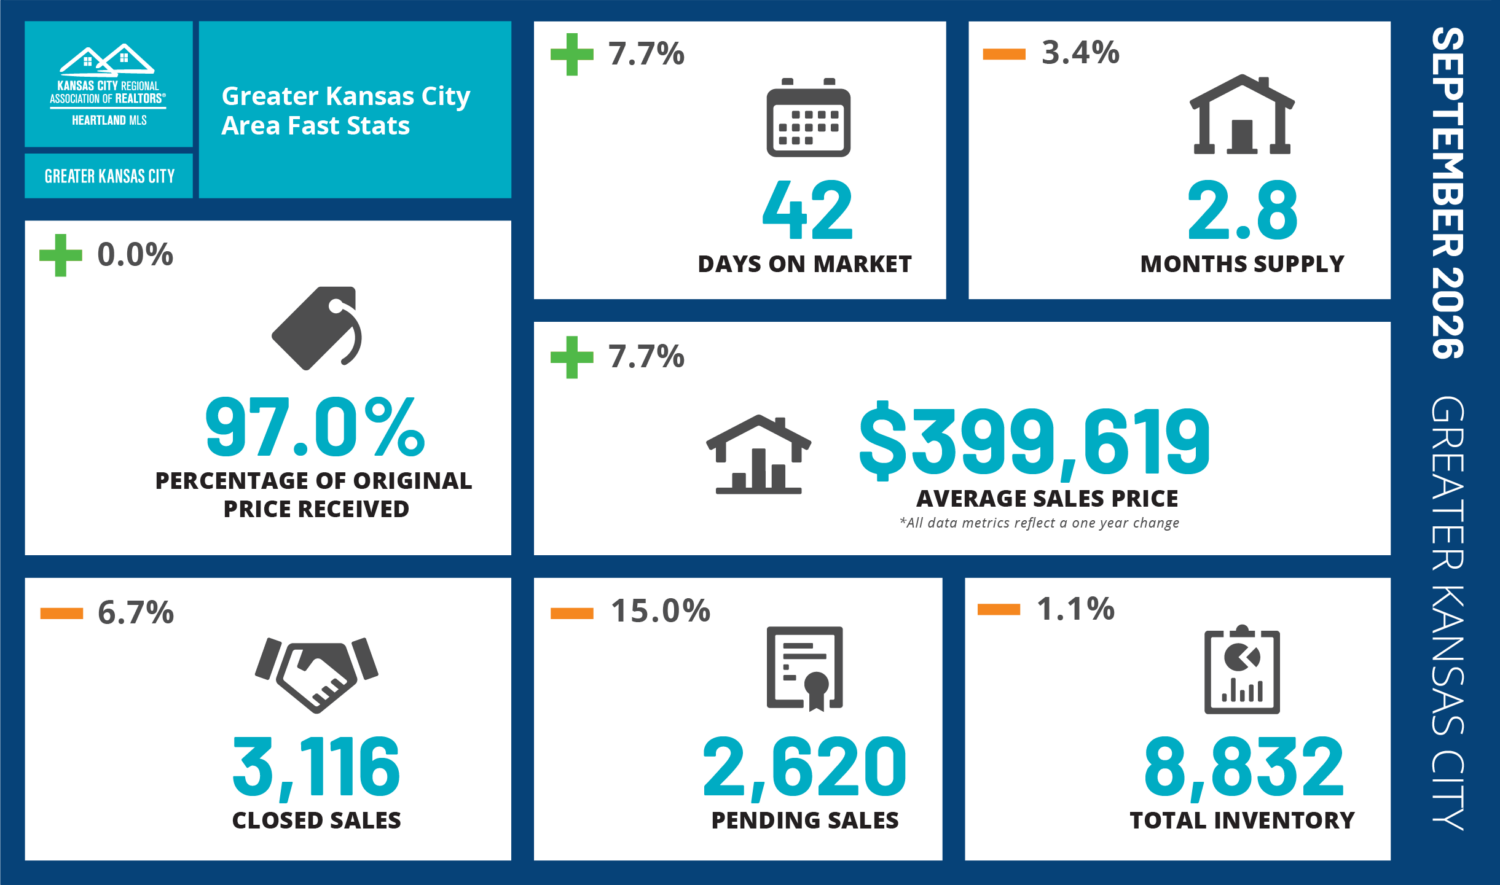
Kansas City's September numbers show the same tension: sale prices remained higher than a year ago while fewer buyers made commitments. The average sale price was $399,619, down 0.9% from August but up 7.7% from last September. The median rose a more modest 3.4% from a year earlier, to $332,000. Neither measure tells us how much an individual home changed in value.
The more immediate concern is the number of buyers signing contracts, which fell 15.0% from a year ago. Homes that sold spent an average of 42 days on the market, compared with 39 last September. More homes were available than in August, giving buyers additional choices, though the count remained slightly below last September.
The usual fall slowdown is part of the backdrop. But these declines compare September with September, so the calendar alone does not explain them.
For buyers, there may be room to negotiate where a seller has fewer alternatives. For sellers, a higher metro average is a weak reason to raise expectations if similar homes nearby are struggling to attract offers. The price buyers will support depends on the choices around the home.
How the Kansas City Metro Compares Nationally
Nationally, inventory increased from last September. Across Heartland MLS, it fell 1.1%. Kansas City buyers are dealing with slower activity without the same broad increase in available homes.
That gives local sellers some support, but it does not mean buyer activity is stronger here on every measure. Local closed sales fell 6.7% from last September, compared with a 2.2% national decline. A home can face serious competition even when the wider market has limited supply. The useful question is how many suitable alternatives a buyer has for that particular home.
What Buyers and Sellers Need to Know Right Now
1. How does the Kansas City metro compare nationally?
September supply was 2.8 months across Heartland MLS, compared with 4.8 months nationally for existing homes. Months of supply estimates how long available homes would last at the recent selling pace. The reports cover different sets of homes, but both point to the importance of the choices around a particular property.
A local seller with few comparable homes nearby may still have a strong position. A buyer considering several suitable alternatives may have room to negotiate. The metro comparison helps frame the search; the home's actual competition guides the decision.
2. Where is the Kansas City metro strong, and where is it softening?
Johnson and Clay counties still had the tightest supply among the counties reviewed, at 2.2 and 2.1 months. But both had fewer buyers signing contracts than last September. Limited supply is helping sellers, while weaker demand makes pricing mistakes harder to overcome.
Leavenworth County held up better on activity. Compared with last September, closed sales rose 5.5% and pending sales rose 4.6%. Its average price increased, though its median fell. Even there, one price measure does not tell the whole story.
Homes that sold in Jackson and Wyandotte counties spent longer on the market than a year earlier, averaging 40 and 37 days, respectively. Both counties also had fewer completed sales and fewer new contracts.
Miami, Platte, and Douglas counties showed mixed conditions. Miami sellers received 94.8% of their original asking price, the lowest share among the counties reviewed. Compared with last September, Platte's prices rose, but pending sales fell 24.3%. Douglas had substantially more inventory than a year earlier, while its average price fell and its median rose.
Cass County, included as a supplemental comparison beyond the eight core counties, adds another useful contrast. Compared with last September, its average sale price jumped 18.1% and inventory increased 13.6%. Supply reached 3.2 months. Sellers should not read the price increase as proof that buyers have fewer choices.
3. What price ranges have the most leverage?
These reports do not break activity into price ranges, so they cannot identify a single price cutoff where buyers or sellers gain control.
The better comparison is between homes a buyer would actually consider. Two homes with the same asking price can have very different monthly costs, repair needs, layouts, and resale prospects. A seller gains strength when the home makes a clear case against those alternatives. A buyer gains strength when several suitable choices remain available.
How the purchase is funded matters too. A cash offer may remove financing uncertainty, but it is not automatically the strongest offer. Sellers still need to compare price, protections, and timing. Cash buyers still need to understand the home's condition.
4. Should buyers move now or wait?
Waiting makes sense when the payment would stretch the budget or the available homes do not fit the plan. A seller's willingness to negotiate does not make the wrong home a good purchase.
If the home does fit, compare the full cost at today's financing terms. Leave room for upkeep and unexpected repairs. Have a lender confirm the payment and any financing options before making the decision. A future rate drop should improve an already workable purchase, rather than be required to make it affordable.
5. Should sellers list now or hold?
Start with what selling would accomplish and whether the home is ready to compete. Fewer buyers were signing contracts in September than a year earlier, which makes pricing and preparation especially important.
If holding gives time to fix a meaningful problem or better supports the next move, it may help. Waiting solely for a stronger market adds uncertainty. Before listing, settle the price, condition, and presentation against the homes buyers can choose today.
If selling also means buying another home, calculate both sides before deciding. Money left from the sale after paying off the loan and selling costs may reduce the next mortgage. Have a lender work through that payment while preserving enough cash for the move and unexpected costs. The difference between two interest rates does not tell the whole story.
6. Where in the Kansas City metro is opportunity showing up?
For buyers, Cass and Douglas counties deserve attention because both had more homes for sale than last September. Miami also warrants a closer look because the gap between original asking prices and final sale prices was wider than in the other counties reviewed.
Those are starting points for a search, not proof that every seller will negotiate. The opportunity depends on the home's condition, its competition, how long it has been available, and what would make the purchase work for both sides.
New construction also belongs in the comparison where it fits the search. If a builder offers financing help, have a lender check the full cost, any lender requirements, and how long the lower payment lasts. A temporary payment reduction should not hide an unaffordable payment later. Compare the actual homes and written offers available in your price range.
For sellers, even a tighter county offers little protection if several similar homes make a stronger case for the same buyer.
7. Are rates likely to change buyer behavior?
Higher borrowing costs can change the home a buyer can comfortably afford. They also make taxes, insurance, repairs, and financing terms more important to the decision. The Federal Reserve influences borrowing costs, but it does not set a buyer's mortgage rate. A Fed announcement is not a promise that a particular loan will become cheaper.
For buyers, compare lender quotes and the full cost of any seller-paid financing help. For sellers, understand that a buyer can like the home and still be unable to support the payment. Any proposed financing help needs to be checked with the buyer's lender. Its value depends on the terms and the buyer's circumstances.
8. Is a correction coming, or is this just normalization?
September does not show a broad decline in Kansas City sale prices. Both the average and median were higher than a year earlier, and inventory remained slightly lower. Through September, completed sales were still 2.5% ahead of the same period in 2025.
The weaker contract activity deserves attention, though. It may put pressure on future sales and on sellers who need to move. One month cannot establish where prices will go next. The current evidence supports watching demand closely without assuming either a broad downturn or continued price gains for every home.
9. What is the smartest move this month?
Buyers should use the time available to compare condition, total cost, and future resale before deciding what to offer. The largest discount is not always the strongest outcome.
Sellers should resolve avoidable objections before the home reaches the market. Buyers form their first opinion from the price, photos, condition, and competing choices. Preparation gives that first impression a better chance to produce a serious offer.
10. What would I do if I were buying or selling right now?
If buying, I would set a payment limit first, then compare homes against the way I expect to live and how long I expect to stay. I would look closely at repair exposure and resale, even when a seller seemed willing to make a deal. Negotiating a lower price would not replace understanding the property.
If selling, I would study the homes buyers can choose instead of mine before setting the asking price. I would address the problems most likely to create doubt and plan the next move so I had room to make decisions without unnecessary pressure.
As the market moves toward better balance between buyers and sellers, understanding where the negotiation begins becomes even more important. It does not start when the offer is written or when an inspection issue appears. Pricing, preparation, timing, competition, presentation, and the choices available to each side are already shaping the negotiation long before that point.
The advantage comes from recognizing those quieter negotiations early and guiding the process instead of reacting to it later.
________________________________________________________________________________________________________________________
Data Sources:
Heartland Multiple Listing Service and Kansas City Regional Association of REALTORS®, September 2026 Greater Kansas City Fast Stats and Local Market Updates for Heartland MLS; Johnson, Leavenworth, Wyandotte, Miami, and Douglas counties in Kansas; and Jackson, Clay, Platte, and Cass counties in Missouri. Reports current as of October 7, 2026. Cass County is supplemental coverage. Month-over-month metro comparisons use the Greater Kansas City Fast Stats images for both August and September 2026.
Realtor.com, September 2026 Monthly Housing Trends Report, released September 30, 2026.
National Association of REALTORS®, September 2026 Existing-Home Sales Report, released October 13, 2026.
National Association of REALTORS®, September 2026 Pending Home Sales Report, released October 20, 2026.
Freddie Mac, Primary Mortgage Market Survey, October 22, 2026.
Keeping Current Matters, October 2026 Monthly Market Report script, for national context and the different pressures facing cash buyers, buyers using financing, existing owners, and builders.
Federal Reserve, Federal Open Market Committee, for the distinction between the federal funds rate and other borrowing costs. National sources checked October 27, 2026.

Founder & Principal | Munkel Real Estate Solutions License ID: KS#00251082 | MO#2024042017
+1(913) 490-6011 | chris@munkelrealestatesolutions.com