

- /
Our Strategic Analysis: Three Steps to Clarity
We move beyond general headlines. Our strategic analysis blends macro data with local expertise, summarized below.

ANALYZE THE MACRO MARKET

DEEP DIVE THE MICRO MARKET
We overlay proprietary local listing data, for the 8 core KC counties to assess local price momentum.

APPLY INSIGHTS TO YOUR HOME
We apply hyper-local data to your property for the most accurate and aggressive price strategy.
National Housing Brief
The national housing market is softening, but the Kansas City metro is not following the same path.
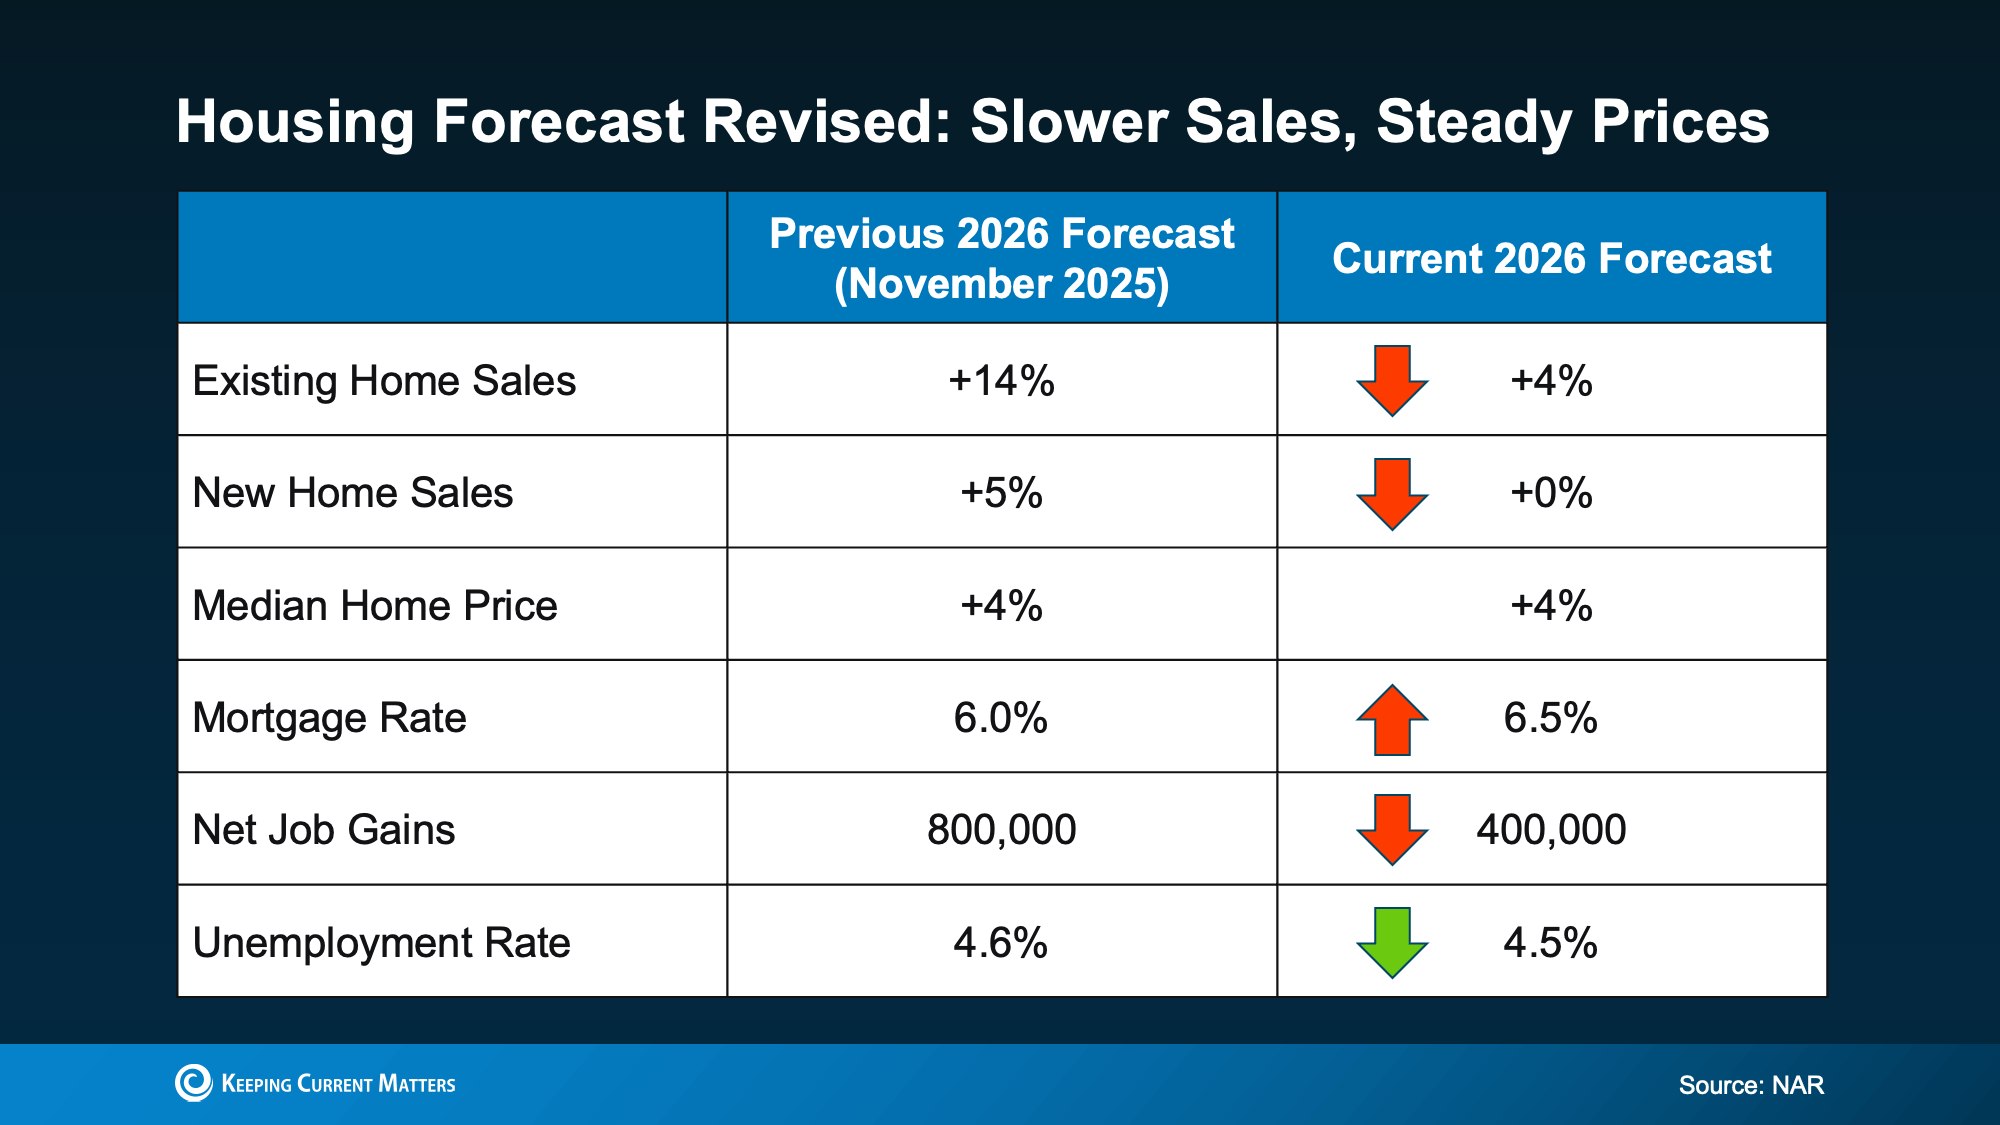
Mortgage rates are sitting around 6.5%, and forecasts from Fannie Mae, MBA, and NAR expect them to stay in the low-to-mid sixes rather than fall sharply. The 2026 sales forecast was revised down from 5.2 million to 4.9 million. The existing-home sales forecast was revised down to 4.2 million. National price growth slowed to 1.7% in Q1 2026.
But national averages hide regional divergence. Some markets are seeing inventory expansion and pricing pressure. Others are holding tighter. The Midwest is outperforming weaker national trends. The Kansas City metro appears on the stronger half of the top-50 metro chart. If you're reading national headlines about softness, this context matters: that softness is not evenly distributed.
The Munkel Thesis:
How the Kansas City Metro Compares Nationally
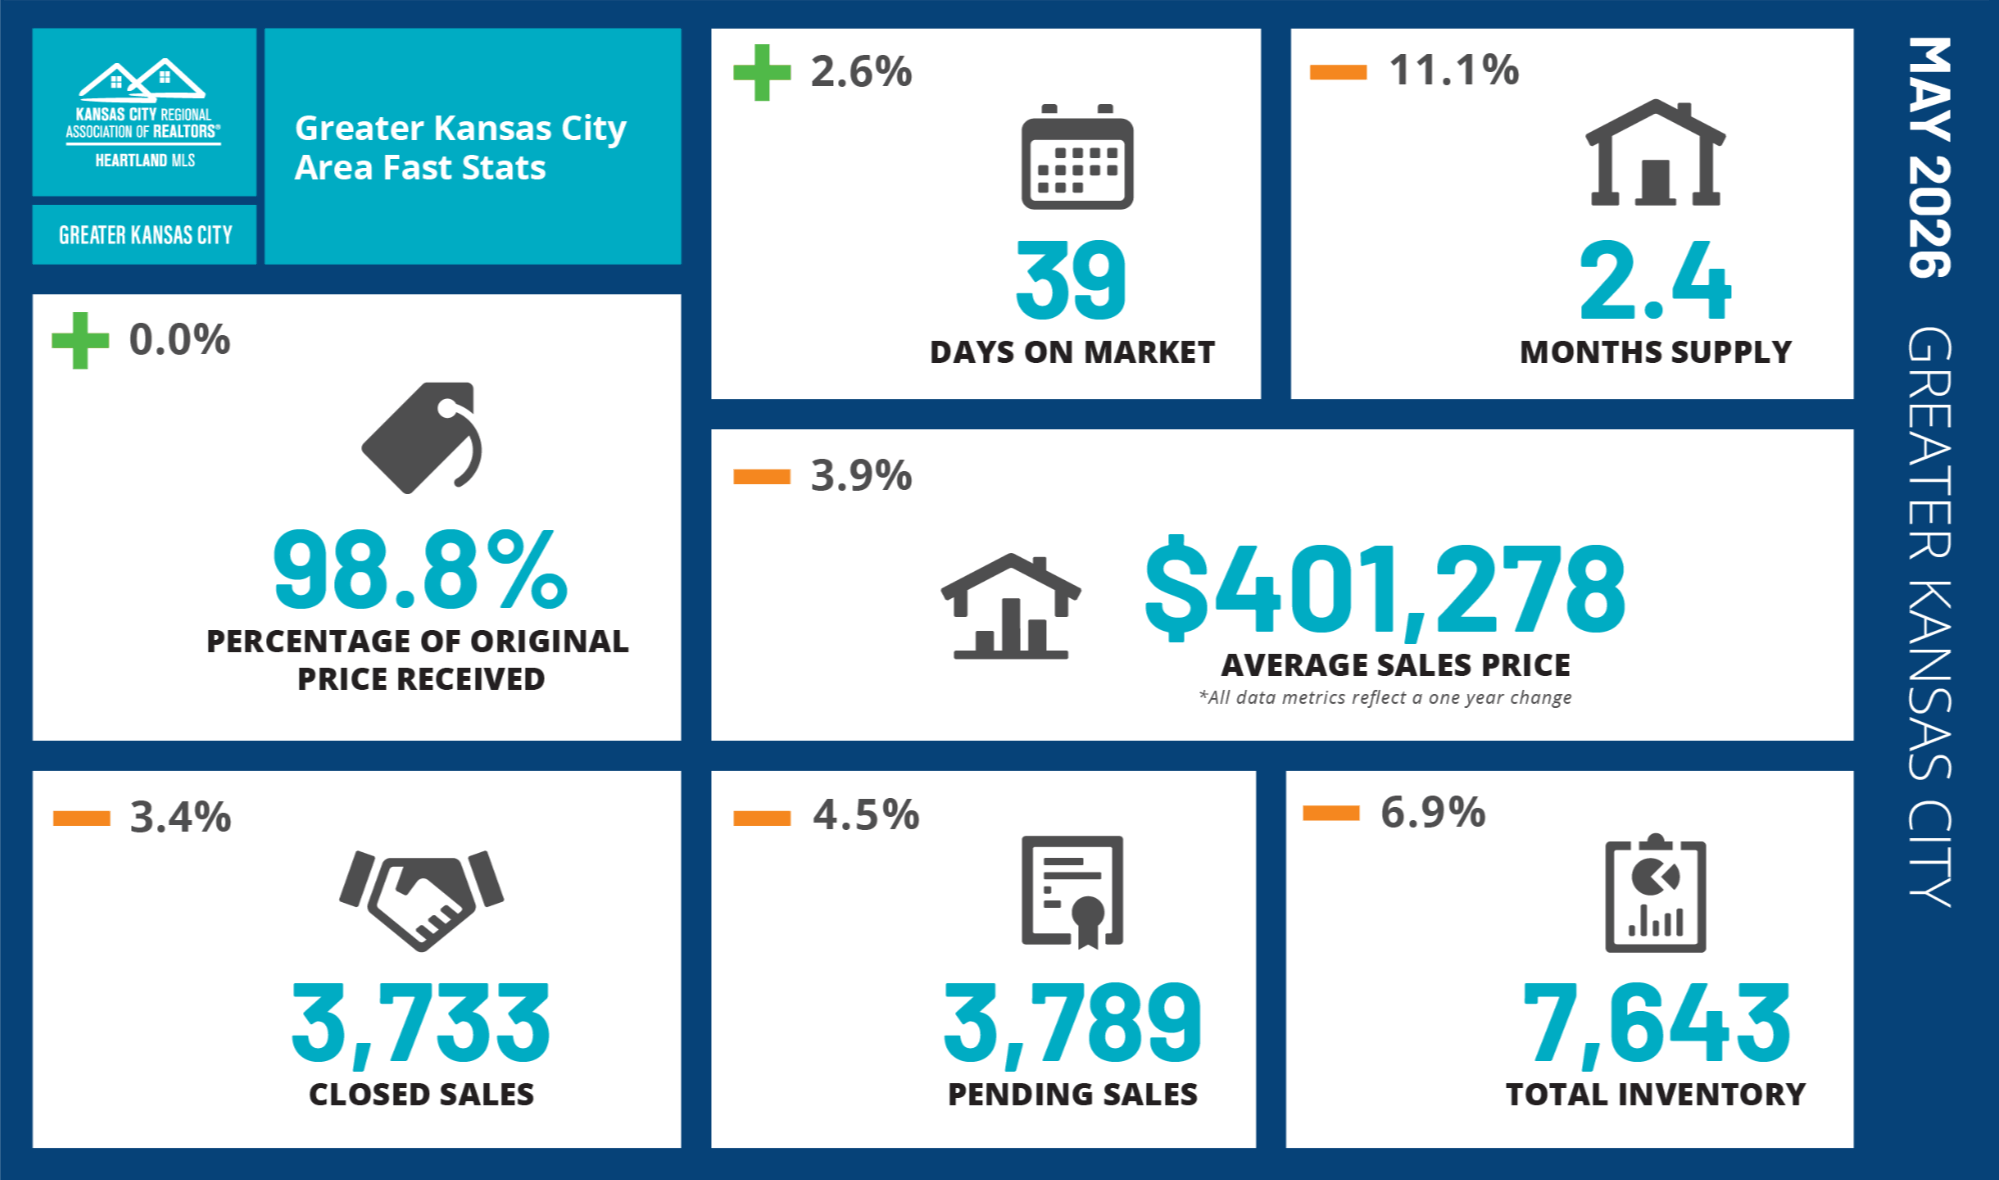
The Kansas City metro is holding up better than many softer national markets. While national markets soften, this region is holding stronger. Days on market improved to 39 days in May, homes are selling at 98.8% of original list price, and month-to-month momentum is accelerating. Activity is up, turnover is faster, and well-positioned homes are still moving.
This is not a market collapsing. This is a market finding its rhythm after early-year strength. The market is moving faster from April to May, but the year-over-year pricing picture got softer in May. That's not a collapse. That's a market getting pickier. Sellers who price correctly are still getting offers. Buyers who move when they find the right fit are still finding homes. This is a market that rewards strategy, not emotion.
________________________________________________________________________________________________________________________
What Buyers and Sellers Need to Know Right Now
1. How does the Kansas City metro compare nationally?
Better. The Kansas City metro is holding up better than many softer national markets. While national markets are cooling, this region is holding inventory tighter and moving homes faster. If you're considering relocating and wondering whether to buy here or elsewhere, the Kansas City metro is one of the stronger regional options right now.
2. Where is the Kansas City metro strong, and where is it softening?
Strong: Johnson County remains the premium anchor in the region, with the highest average price at $561,522, fast turnover at 30 days on market, and sellers still receiving 101.3% of original list price in May. Platte County is accelerating with days on market dropping from 57 to 30 days month-to-month. Clay County is solid with activity increasing and supply staying tight at 1.8 months.
Steadying: Jackson County still looks steadier than hotter. The year-over-year activity picture is softer, but from April to May, pending sales and pace both improved.
Mixed signals: Miami looked cleaner in May with a significant 24-day improvement in days on market. Douglas still looks more balanced than weak, with more buyer choice developing.
The real story: Month-to-month momentum is improving across most segments. Homes are moving faster in May than they were in April. Sellers who price for the market in front of them are moving inventory. Sellers who price for the market they wish they had are sitting longer.
3. What price ranges have the most leverage?
The answer depends on which side of the transaction you're on, and it's important context if you're operating in the sub-$400k range.
For buyers under $400k: This is the most competitive segment in the market right now. First-time homebuyers are concentrated here, and when a well-priced home hits the market, it draws multiple offers quickly. You may not get the first home you offer on. You may not get the second or third. Patience and a solid pre-approval letter matter. Properties that are well-maintained, well-priced, and ready to show move fast. Properties that need work or are overpriced sit longer. In this range, you have more inventory to choose from, but competition is real and immediate.
For sellers under $400k: That competition among buyers is your advantage. Priced correctly, your home will attract multiple offers. In practice, this segment is still moving, which means buyer interest is high. This is a segment where pricing discipline pays immediate dividends.
For buyers above $400k: You have more breathing room. Inventory is less concentrated, buyer competition is lower, and marketing time is longer. You can be more selective.
For sellers above $400k: You need sharper positioning. Inventory above $400k isn't scarce, but the buyer pool is smaller. Pricing, condition, and presentation matter more.
4. Should buyers move now or wait?
That depends on your situation, timeline, and goals—and that's a conversation worth having. But the data shows:
Mortgage rates are expected to stay in the low-to-mid sixes rather than fall sharply. The difference between 6.5% and 6.0% on a $400k mortgage is roughly $140 a month. Waiting six months hoping rates fall that amount may cost you if market variables change or the right home becomes available. Homes are moving faster in May than April. Inventory is down 6.9% year-over-year. Depending on your price range, availability is constrained.
If you haven't found the right property yet, waiting is fine. But waiting for rates to drop or for a market crash is not the same as waiting for the right home. Those are different timelines and different strategies.
5. Should sellers list now or hold?
That depends on your specific circumstances—your timeline, your financial situation, whether renting makes sense for your situation, and your goals. That's a conversation worth having with someone who understands your full picture.
What the data shows: Closed sales jumped 11.2% from April to May. Pending sales are up. Homes are selling faster. Days on market improved from 48 to 39 days metro-wide. Month-to-month trend is moving. If your home is in good condition, priced correctly for the current market, and ready to be shown, the market environment is more favorable in May than it was in April.
If you're holding because you expect a big near-term jump in prices, the current data doesn't give you much support for that. But market variables are always at play. That's something worth discussing based on your timeline and goals.
6. Where in the Kansas City metro is opportunity showing up?
Miami County had the sharpest market reset. Days on market dropped from 70 to 46 in one month—a 24-day improvement. Closed sales surged 14.9% year-over-year. If you were looking at Miami in April and saw homes sitting too long, the market appears to have found a clearing price. Revisiting that market now could be worth your time.
Wyandotte County showed a pricing and pace recovery in May. Average price jumped 11.5% from April. Days on market improved to 27 days. If Wyandotte was on your radar but you were skeptical about April's softness, the trend shifted.
Platte County is accelerating notably. Homes that were on market 57 days are now moving in 30 days. That's significant month-to-month improvement. If Platte is in your consideration set, this is an active market right now.
Johnson County remains consistent. Premium pricing, tight supply, strong demand. No surprises, but no weakness either.
7. Are rates likely to change buyer behavior?
Rates are currently expected to stay in the low-to-mid sixes rather than fall sharply. That means expecting a significant rate drop as a catalyst for buying is not realistic based on current forecasts. The difference between 6.5% and 6.0% is material but not transformational—roughly $140 a month on a $400k mortgage.
What will change buyer behavior more immediately: inventory tightening further, prices rising, or homes disappearing faster. Those are the real market constraints on buyers right now.
8. Is a correction coming, or is this just normalization?
This appears to be normalization, not correction. Here's the distinction:
Correction signals we're NOT seeing: Foreclosures remain far below historical levels. Two-thirds of homeowners have paid off their mortgage or carry at least 50% equity. Owners collectively hold $34.1 trillion in equity. That equity cushion prevents the kind of panic selling that creates crashes. But market variables—geopolitical events, economic shifts, unexpected rate movements—can always change market dynamics. Those are beyond our control.
Normalization signals we ARE seeing: Prices moving differently month-to-month versus year-over-year. Sellers who overprice having to adjust. Days on market extending in softer segments. Buyers getting more time to think. Inventory is still tight year over year, even though buyers had slightly more options from April to May.
May's year-over-year metro price reading came in softer at -3.9%, even though average price rose from April to May. That's not a contradiction. It means year-over-year and month-to-month numbers are telling different parts of the story. This is not a crash. It's a market getting more selective.
9. What is the smartest move this month?
For buyers: If you've been house-hunting and found something that fits your needs and budget, the data suggests May is a stronger market environment than April. Inventory is constrained, rate movement is unlikely to be dramatic, and homes are moving. That's worth a conversation with your agent about whether the timing makes sense for your situation. If you're in the sub-$400k range, competition is real, so when you find the right home, moving quickly matters.
For sellers: If your home is market-ready and you've priced it for the current market, the data shows month-to-month momentum improving. Homes are moving faster. Activity is up. That's a conversation worth having about whether listing now aligns with your timeline and goals. In the sub-$400k range especially, pricing correctly attracts multiple buyers. Overpricing costs you marketing time without offsetting your final sale price.
10. What would I do if I were buying or selling right now?
If I were buying: I'd focus on finding the right property in my price range rather than waiting for external market conditions to change. I'd get pre-approved, understand the local market dynamics in my segment (especially if I'm under $400k where competition is high), and be ready to move on the right home when I found it. I'd stop waiting for rates to drop—current expectations are for them to stay relatively flat. I'd stop waiting for a buyer's market with unlimited inventory—inventory is constrained. I'd find a competent agent who understands my local market and can show me where opportunity is showing up, and I'd execute when the timing was right for my situation.
If I were selling: I'd price it for the market in front of you, not the market you wish you still had. I'd make sure the home shows well. I'd list when I was ready to sell, which is a decision based on my timeline and goals, not market timing. I'd expect competition from other inventory, especially in my price range, but would trust that pricing correctly gets me sold faster and for better money than overpricing and sitting. I would not try to time a price recovery. I would not hold hoping for a different market in six months. This is the market. Price accordingly, execute well, and move forward.
________________________________________________________________________________________________________________________
Data Sources: Heartland MLS / KCRAR FastStats May 2026 monthly data and county market updates; Keeping Current Matters June 2026 Monthly Market Report.

Founder & Principal | Munkel Real Estate Solutions | License ID: KS#00251082 | MO#2024042017
+1(913) 490-6011 | chris@munkelrealestatesolutions.com